Majors:
|
Minors
|
Ranked by 2019 US/Canadian market share.
| Studio parent (conglomerate) |
Major film studio unit
Secondary studio |
Year founded | Arthouse/indie | Genre movie/B movie | Animation | Other divisions and brands | US/CA market share (2019) | ||
|---|---|---|---|---|---|---|---|---|---|
| Walt Disney Studios (The Walt Disney Company) |
Walt Disney Pictures
|
1923
1935 |
Walt Disney Studios Motion Pictures
Walt Disney Studios Sony Pictures Releasing (JV) |
33.5% | |||||
| WarnerMedia (AT&T) |
Warner Bros.
|
1923
1967 |
13.9% | ||||||
| Sony Pictures (Sony) |
Columbia Pictures
|
1924
1982 |
Sony Pictures Worldwide AcquisitionsSony Wonder
Stage 6 Films
TriStar Productions,
Walt Disney Studios Sony Pictures Releasing (JV) |
12.1% | |||||
| NBCUniversal (Comcast) |
Universal Pictures | 1912 |
OTL Releasing
United International Pictures (JV)
Universal 1440 Entertainment
WT2 Productions
|
11.5% | |||||
| ViacomCBS (National Amusements) |
Paramount Pictures | 1912 |
Miramax (49%)
|
Awesomeness Films
Melange Pictures
United International Pictures (JV)
|
Viacom 18 Motion Pictures (49%)
Viacom Digital Studios
|
5% | |||
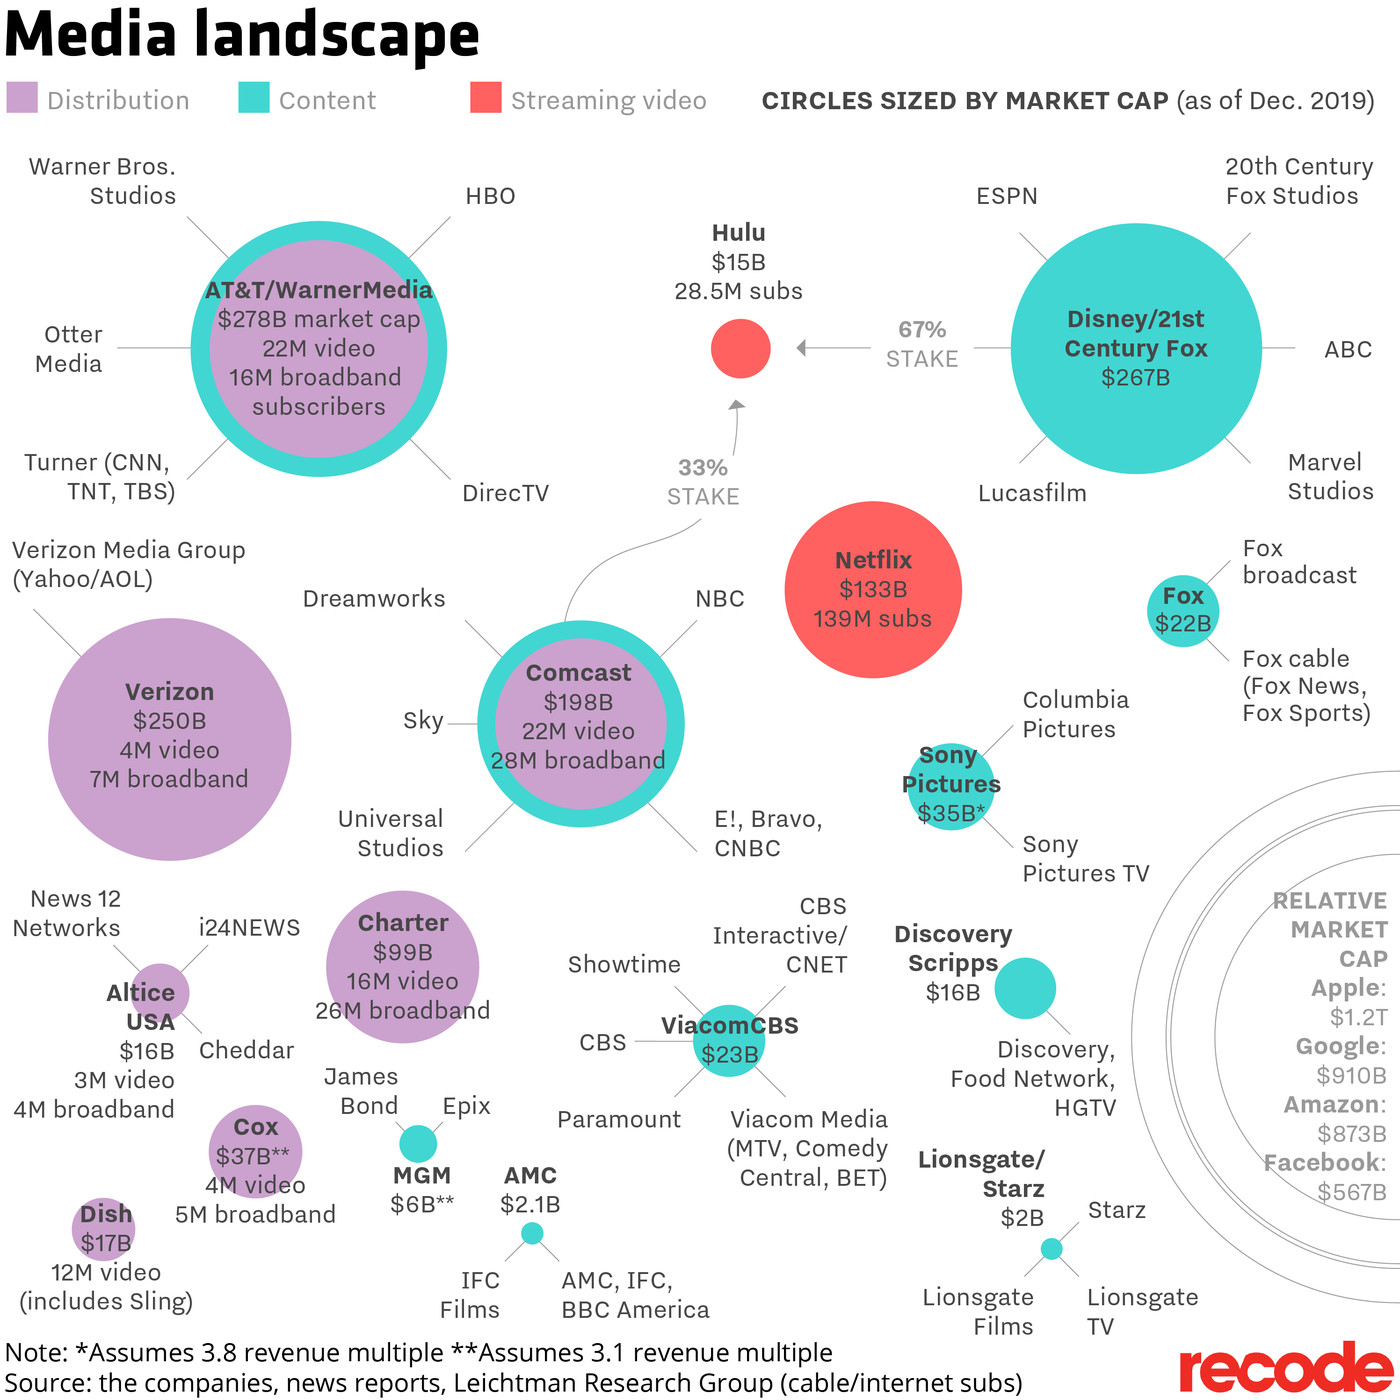
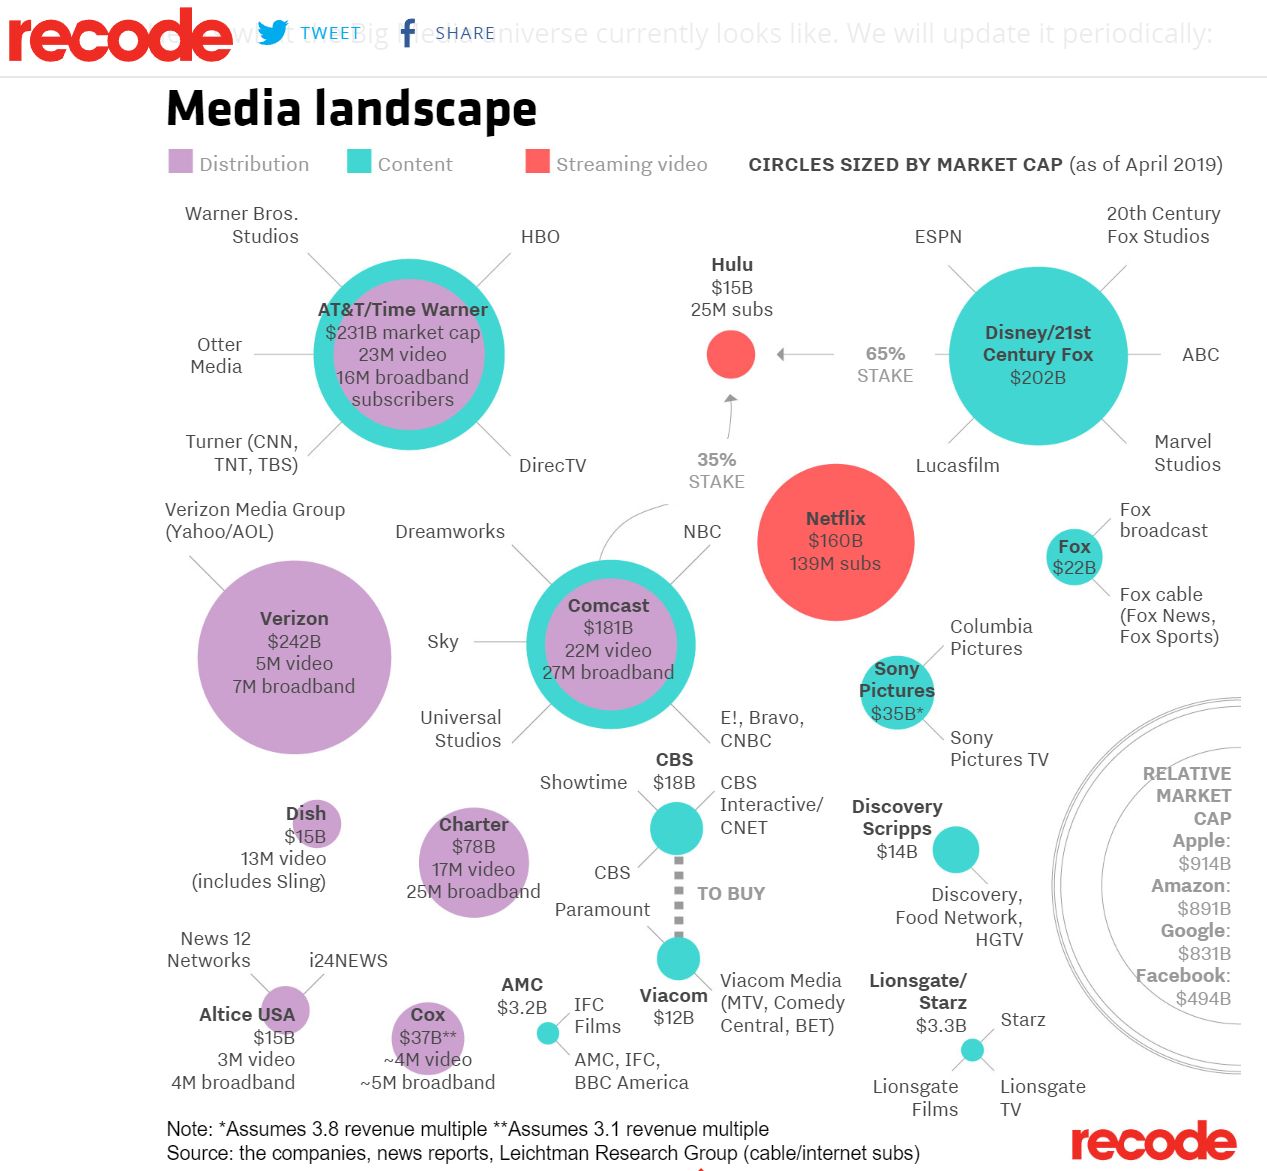
Circles sized by market cap.
Ranked by 2018 US/Canadian market share.
Source: Wikipedia contributors, "Major film studio," Wikipedia, The Free Encyclopedia, https://en.wikipedia.org/wiki/Major_film_studio#Current (accessed April 22, 2019).
Circles sized by market cap.
Source: Wikipedia contributors, "Major film studio," Wikipedia, The Free Encyclopedia, https://en.wikipedia.org/wiki/Major_film_studio#Current (accessed April 24, 2017).
Ranked by 2015 US/Canadian market share.
Source: Wikipedia contributors, "Major film studio," Wikipedia, The Free Encyclopedia, https://en.wikipedia.org/wiki/Major_film_studio#Current (accessed April 25, 2016).
Ranked by 2014 US/Canadian market share.
Source: Wikipedia contributors, "Major film studio," Wikipedia, The Free Encyclopedia, http://en.wikipedia.org/w/index.php?title=Major_film_studio&oldid=656551077 (accessed April 20, 2015).
Ranked by 2012 US/Canadian market share.
Ranked by 2011 US/Canadian market share.
Sources: Wikipedia contributors, "Major film studio," Wikipedia, The Free Encyclopedia, http://en.wikipedia.org/w/index.php?title=Major_film_studio&oldid=488841216 (accessed April 23, 2012; and The Numbers.Source: Wikipedia.
January 1–December 31, 2015
Overall Gross: $11.495 billion
| Rank | Distributor | Market Share |
Total Gross* |
Movies Tracked |
2015 Movies** |
| 1 | Universal | 21.3% | $2,444.9 | 23 | 21 |
| 2 | Buena Vista | 19.8% | $2,280.2 | 15 | 11 |
| 3 | Warner Bros. | 13.9% | $1,603.1 | 38 | 26 |
| 4 | 20th Century Fox | 11.3% | $1,302.9 | 24 | 17 |
| 5 | Sony / Columbia | 8.4% | $966.3 | 20 | 16 |
| 6 | Paramount | 5.9% | $674.7 | 16 | 12 |
| 7 | Lionsgate | 5.9% | $673.8 | 27 | 25 |
| 8 | New Line | 2.9% | $337.4 | 6 | 4 |
| 9 | Weinstein Company | 2.6% | $301.5 | 14 | 11 |
| 10 | Fox Searchlight | 1.0% | $119.3 | 11 | 8 |
| 11 | Focus Features | 1.0% | $117.6 | 12 | 10 |
| 12 | Relativity | 0.6% | $74.2 | 6 | 4 |
Source: Box Office Mojo
January 1–December 31, 2014
Overall Gross: $10.361 billion
| Rank | Distributor | Market Share |
Total Gross* |
Movies Tracked |
2014 Movies** |
| 1 | 20th Century Fox | 17.3% | $1,790.5 | 22 | 17 |
| 2 | Buena Vista | 15.6% | $1,617.5 | 17 | 13 |
| 3 | Warner Bros. | 15.1% | $1,562.4 | 31 | 22 |
| 4 | Sony / Columbia | 12.2% | $1,261.5 | 22 | 19 |
| 5 | Universal | 10.8% | $1,115.3 | 18 | 14 |
| 6 | Paramount | 10.2% | $1,052.9 | 18 | 14 |
| 7 | Lionsgate | 7.1% | $736.9 | 22 | 18 |
| 8 | Weinstein Company | 2.1% | $222.0 | 19 | 15 |
| 9 | Relativity | 1.8% | $186.5 | 12 | 8 |
| 10 | Open Road Films | 1.6% | $162.7 | 9 | 7 |
| 11 | Fox Searchlight | 1.4% | $147.8 | 11 | 8 |
| 12 | Focus Features | 1.2% | $126.0 | 12 | 11 |
Source: Box Office Mojo
January 1–December 31, 2012
Overall Gross: $10.821 billion
| Rank | Distributor | Market Share |
Total Gross* |
Movies Tracked |
2012 Movies** |
| 1 | Sony / Columbia | 16.6% | $1,792.2 | 25 | 19 |
| 2 | Warner Bros. | 15.4% | $1,665.4 | 36 | 24 |
| 3 | Buena Vista | 14.3% | $1,551.4 | 18 | 13 |
| 4 | Universal | 12.2% | $1,323.9 | 17 | 16 |
| 5 | Lionsgate | 11.5% | $1,239.1 | 22 | 22 |
| 6 | 20th Century Fox | 9.5% | $1,025.4 | 19 | 15 |
| 7 | Paramount | 8.4% | $914.4 | 21 | 14 |
| 8 | Weinstein Company | 2.4% | $258.2 | 18 | 15 |
| 9 | Relativity | 1.9% | $202.4 | 6 | 5 |
| 10 | Focus Features | 1.3% | $144.6 | 10 | 8 |
| 11 | Open Road Films | 1.3% | $136.4 | 5 | 5 |
| 12 | Fox Searchlight | 1.1% | $117.8 | 10 | 7 |
January 1–December 31, 2011
Overall Gross: $10.174 billion
| Rank | Distributor | Market Share |
Total Gross* |
Movies Tracked |
2011 Movies** |
| 1 | Paramount | 19.2% | $1,957.1 | 21 | 15 |
| 2 | Warner Bros. | 17.9% | $1,826.2 | 38 | 26 |
| 3 | Sony / Columbia | 12.5% | $1,273.7 | 28 | 23 |
| 4 | Buena Vista (Disney) | 12.2% | $1,240.7 | 17 | 14 |
| 5 | Universal | 10.2% | $1,040.6 | 17 | 15 |
| 6 | 20th Century Fox | 9.6% | $977.9 | 19 | 15 |
| 7 | Summit Entertainment | 4.0% | $411.6 | 10 | 8 |
| 8 | Weinstein Company | 2.9% | $296.1 | 17 | 15 |
| 9 | Relativity | 2.2% | $228.1 | 8 | 7 |
| 10 | Lionsgate | 1.8% | $184.0 | 15 | 12 |
| 11 | Fox Searchlight | 1.5% | $152.4 | 13 | 11 |
| 12 | Focus Features | 1.2% | $126.9 | 9 | 8 |
| 2000 | 1999 | |
| Buena Vista (Disney) | 14.7% | 17.0% |
| Universal | 14.5% | 12.7% |
| AOL Time Warner | 11.9% | 14.2% |
| Paramount | 10.5% | 11.6% |
| Dreamworks | 10.3% | 4.4% |
| 20th Century Fox | 9.7% | 10.8% |
| Sony | 8.8% | 8.6% |
| Miramax | 6.3% | 4.3% |
| New Line | 5.2% | 4.2% |
| MGM | 1.3% | 4.2% |
| Artisan | 2.6% |
Top Grossing Movies of All Time at the USA Box Office: the-numbers.com or the Internet Movie Database
|
|||||||||||||||||||||||||||||||||||||||||||||||||||||||||||||||||||||||||||||||||||||||||||||||||||||
Source: Box Office Mojo.
| ank | Movie Title (click to view) | Studio |
Total Gross / Theaters | Opening / Theaters | Open | Close | ||
| 1 | Star Wars: The Force Awakens | BV | $935,910,912 | 4,134 | $247,966,675 | 4,134 | 12/18 | - |
| 2 | Jurassic World | Uni. | $652,270,625 | 4,291 | $208,806,270 | 4,274 | 6/12 | 11/19 |
| 3 | Avengers: Age of Ultron | BV | $459,005,868 | 4,276 | $191,271,109 | 4,276 | 5/1 | 10/8 |
| 4 | Inside Out | BV | $356,461,711 | 4,158 | $90,440,272 | 3,946 | 6/19 | 12/10 |
| 5 | Furious 7 | Uni. | $353,007,020 | 4,022 | $147,187,040 | 4,004 | 4/3 | 7/24 |
| 6 | Minions | Uni. | $336,045,770 | 4,311 | $115,718,405 | 4,301 | 7/10 | 12/17 |
| 7 | The Hunger Games: Mockingjay - Part 2 | LGF | $281,723,902 | 4,175 | $102,665,981 | 4,175 | 11/20 | 2/25 |
| 8 | The Martian | Fox | $228,433,663 | 3,854 | $54,308,575 | 3,831 | 10/2 | 3/17 |
| 9 | Cinderella (2015) | BV | $201,151,353 | 3,848 | $67,877,361 | 3,845 | 3/13 | 9/17 |
| 10 | Spectre | Sony | $200,074,609 | 3,929 | $70,403,148 | 3,929 | 11/6 | 4/7 |
Source: Box Office Mojo.
| Rank | Movie Title | Studio |
Total Gross / Theaters | Opening / Theaters | Open | Close | ||
| 1 | American Sniper | WB | $347,762,901 | 3,885 | $633,456 | 4 | 12/25 | - |
| 2 | The Hunger Games: Mockingjay - Part 1 | LGF | $337,135,885 | 4,151 | $121,897,634 | 4,151 | 11/21 | 3/19 |
| 3 | Guardians of the Galaxy | BV | $333,176,600 | 4,088 | $94,320,883 | 4,080 | 8/1 | 1/22 |
| 4 | Captain America: The Winter Soldier | BV | $259,766,572 | 3,938 | $95,023,721 | 3,938 | 4/4 | 8/21 |
| 5 | The LEGO Movie | WB | $257,760,692 | 3,890 | $69,050,279 | 3,775 | 2/7 | 9/4 |
| 6 | The Hobbit: The Battle of the Five Armies | WB | $255,119,788 | 3,875 | $54,724,334 | 3,875 | 12/17 | 4/2 |
| 7 | Transformers: Age of Extinction | Par. | $245,439,076 | 4,233 | $100,038,390 | 4,233 | 6/27 | 10/9 |
| 8 | Maleficent | BV | $241,410,378 | 3,948 | $69,431,298 | 3,948 | 5/30 | 12/4 |
| 9 | X-Men: Days of Future Past | Fox | $233,921,534 | 4,001 | $90,823,660 | 3,996 | 5/23 | 10/9 |
| 10 | Big Hero 6 | BV | $222,404,450 | 3,773 | $56,215,889 | 3,761 | 11/7 | |
Source: Box Office Mojo